facebook lead ads benchmark
how lead ads have impacted
the lead gen business
we analyzed over 10 million leads collected with facebook lead ads. that what we discovered.
we analyzed over 10 million leads collected with facebook lead ads. that what we discovered.

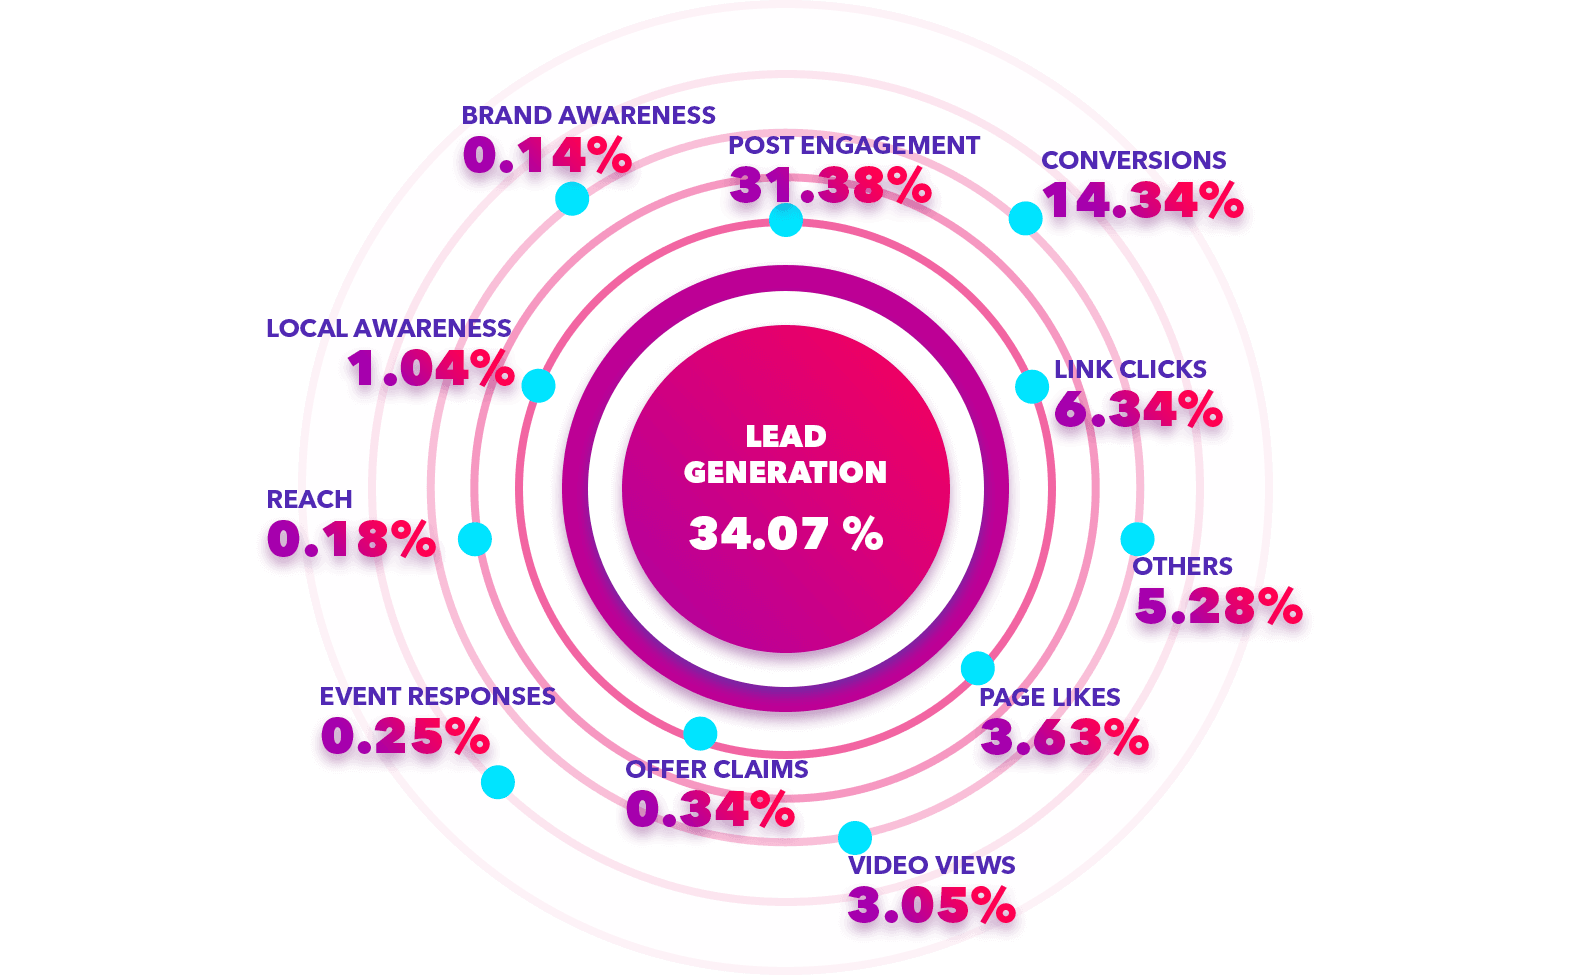
Lead Generation Goals
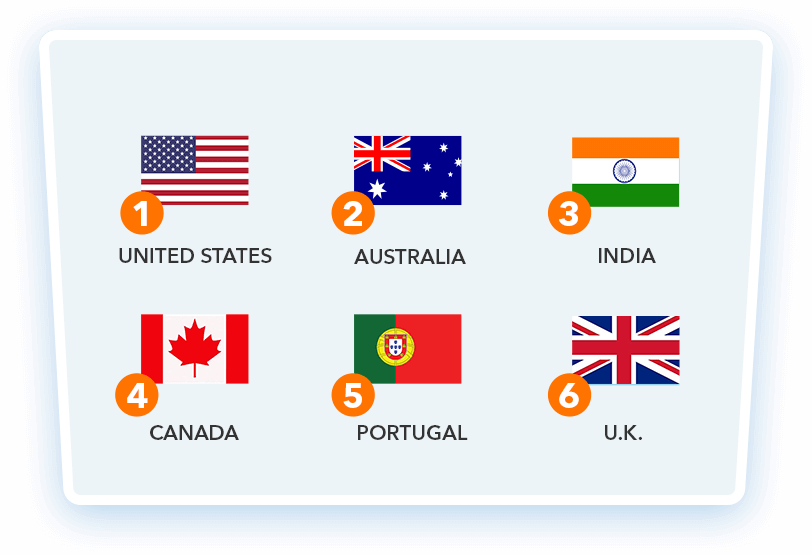
Which country
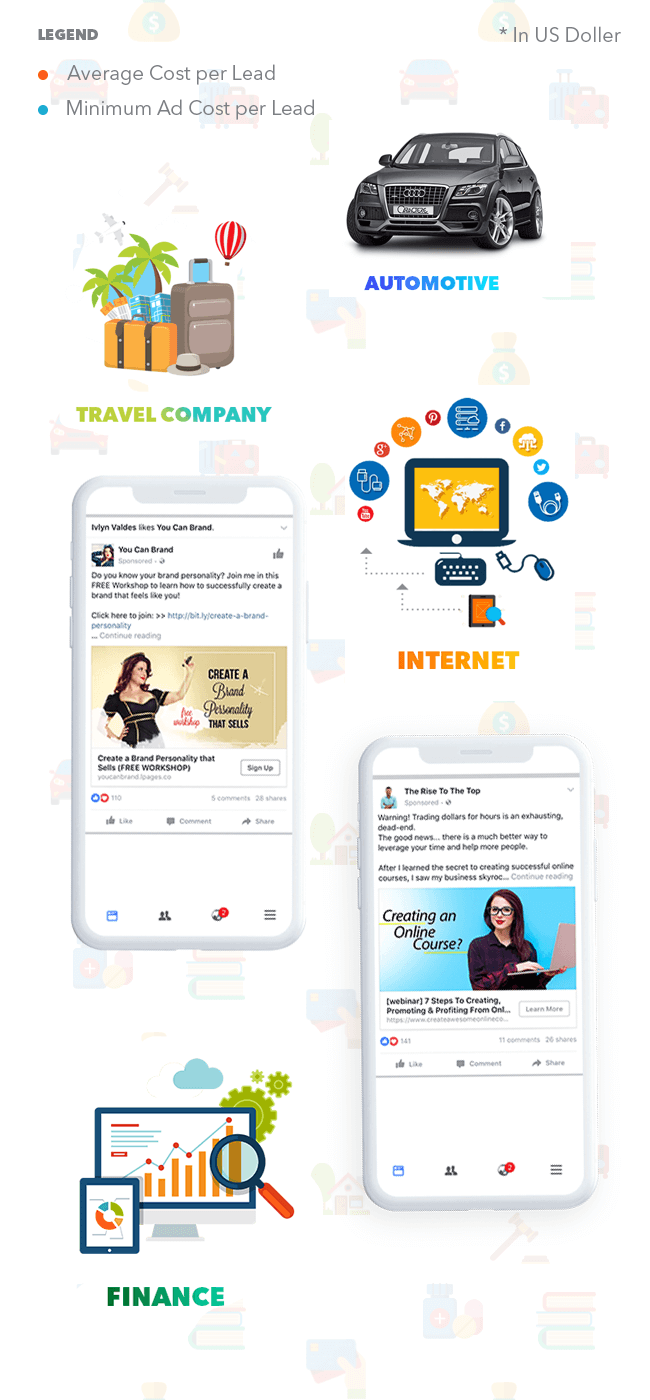
Which industry

Which country
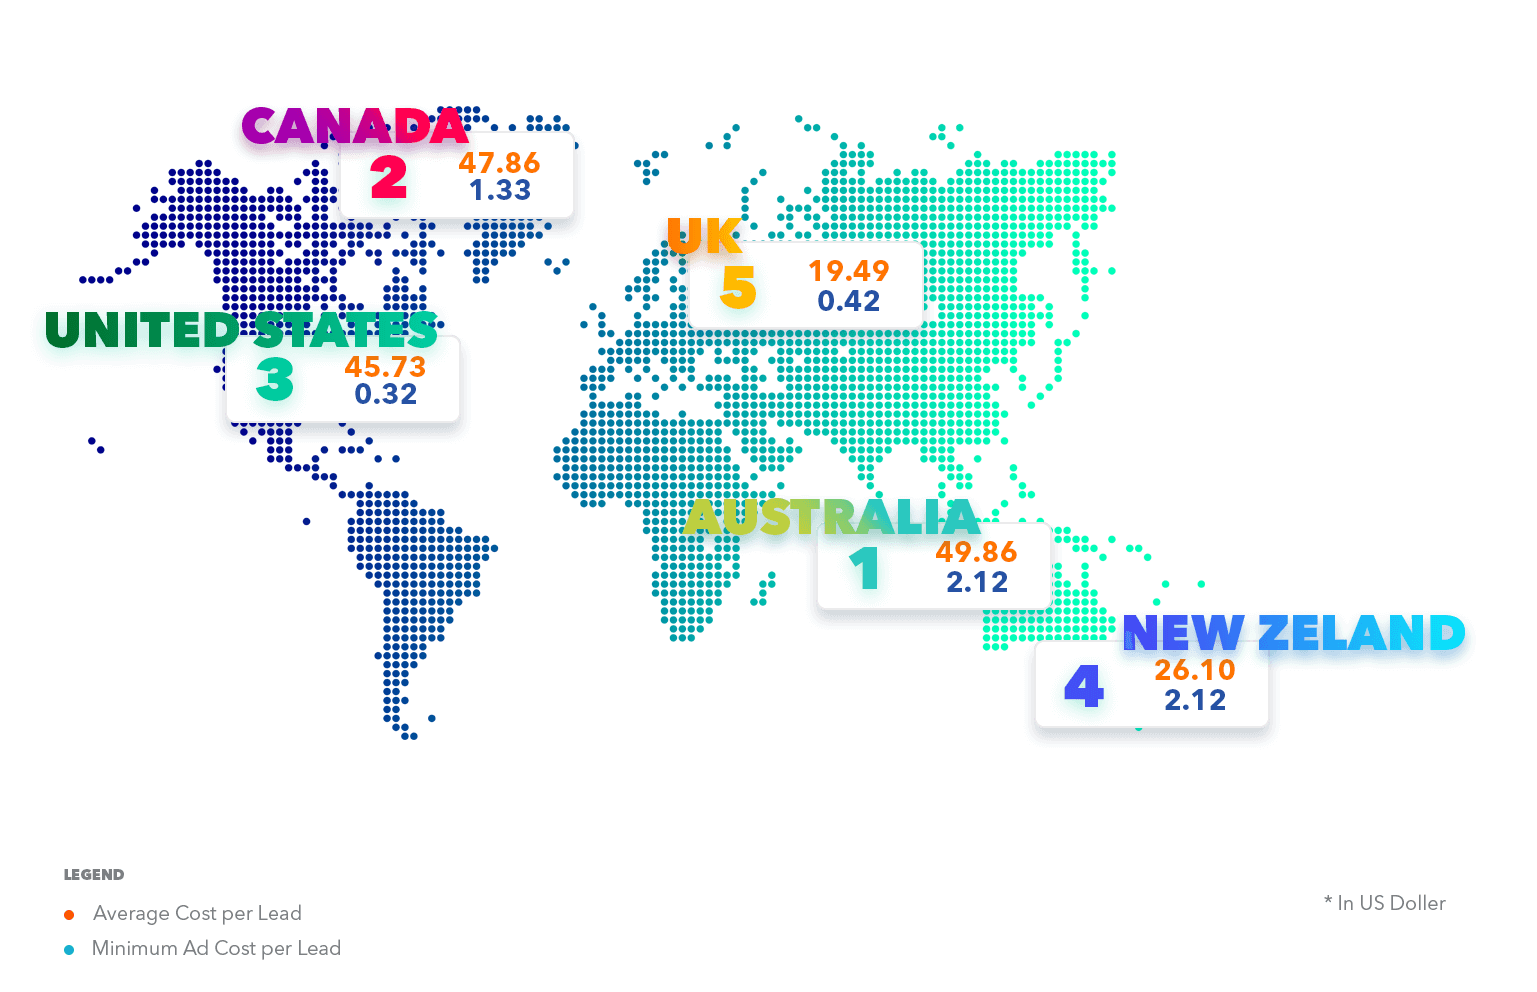
| # | Country | Average | Minimum |
|---|---|---|---|
| 1 | Australia | 49.86 | 0.87 |
| 2 | Canada | 47.86 | 1.33 |
| 3 | United States | 45.73 | 0.32 |
| 4 | New Zealand | 26.10 | 2.12 |
| 5 | U.K | 19.49 | 0.42 |
| 6 | Portugal | 19.40 | 7.62 |
| 7 | Singapore | 16.75 | 0.48 |
| 8 | Israel | 15.07 | 1.75 |
| 9 | Spain | 14.23 | 0.74 |
| 10 | German | 13.33 | 3.53 |
| 11 | Italy | 11.46 | 0.36 |
| 12 | India | 10.90 | 0.29 |
| # | Country | Average | Minimum |
|---|---|---|---|
| 13 | Slovenia | 6.35 | 5.05 |
| 14 | Thailand | 6.31 | 0.50 |
| 15 | Colombia | 6.12 | 0.11t |
| 16 | Austria | 5.36 | 1.86 |
| 17 | Puerto Rico | 4.98 | 1.72 |
| 18 | Argentina | 4.39 | .027 |
| 19 | Arab Emirates | 3.60 | 0.67 |
| 20 | Brazil | 3.51 | 0.18 |
| 21 | Costa Rica | 3.03 | 0.24 |
| 22 | Mexico | 2.47 | 0.32 |
| 23 | Chile | 2.27 | 0.67 |
| 24 | Ecuador | 2.27 | 0.67 |
| 25 | South Africa | 0.65 | 0.17 |
Which industry
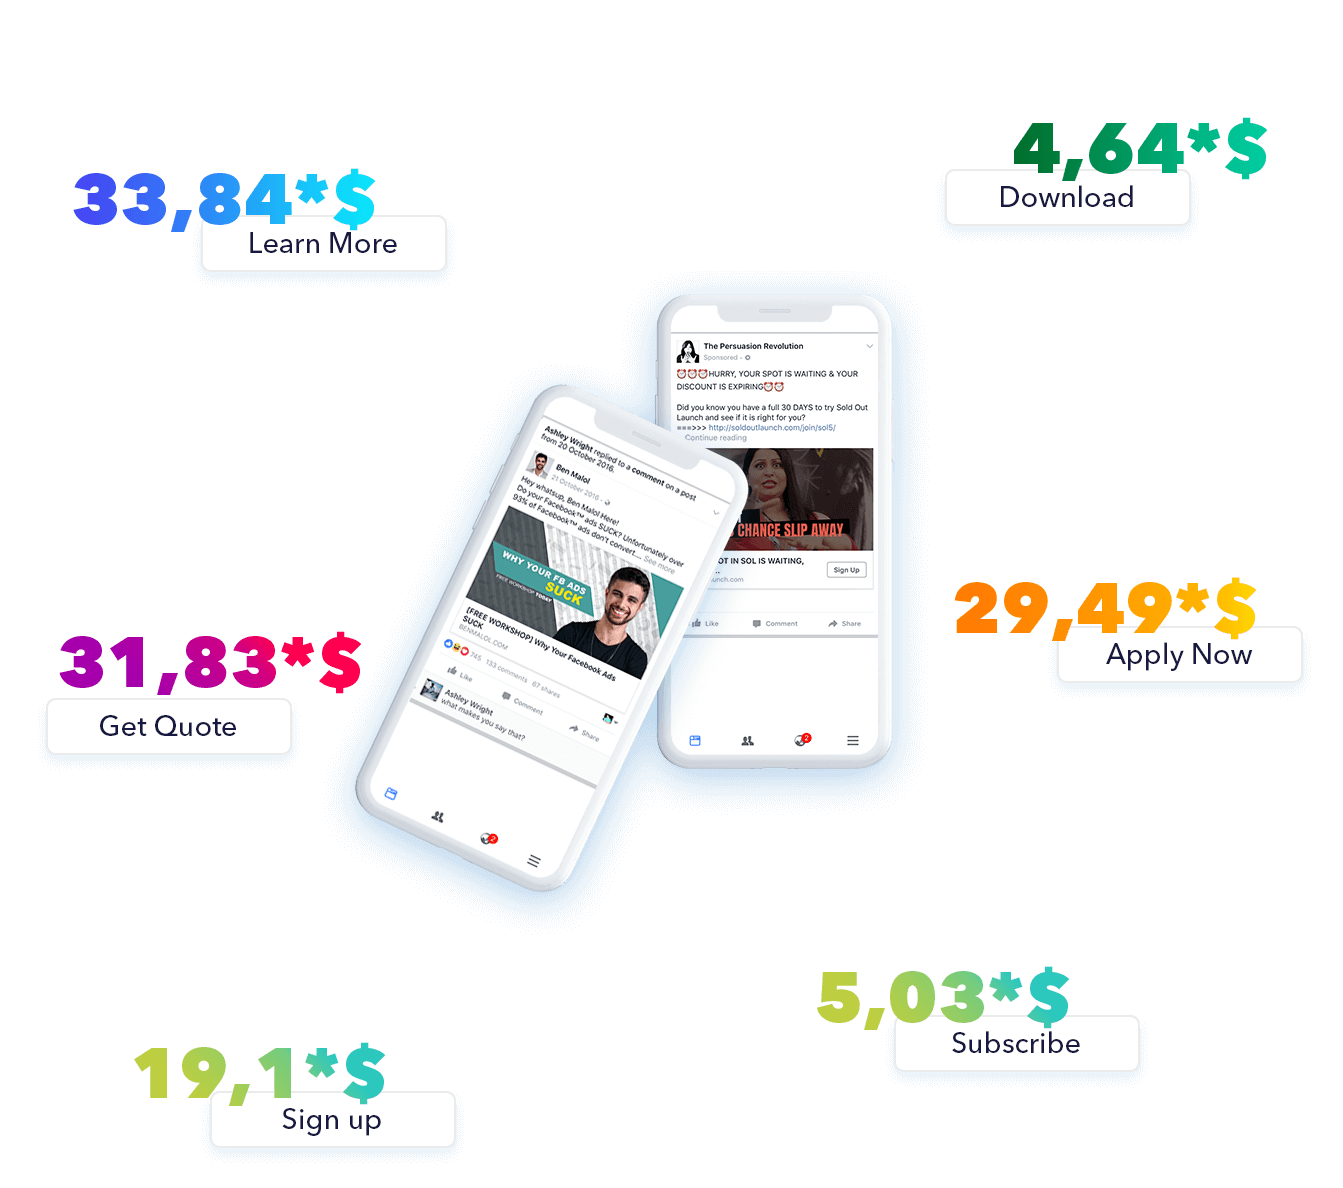
How advertisers are